Dashboard
You will find all the resources to operate as well as decision making information on the dashboard ot the application home page. The HOME page consists of four tabs namely: Dashboard, Data Statistics, First Response Pie Chart and Success Pie Chart.
Dashboard
The dashboard shows the appointments or tasks assigned in three possible views:
- Calendar: This is default. Double click on appointment to open the ticket.
- KANBAN Board: Double click on KANBAN card to open the ticket.
- List: Open button is given on left most column of the list row.
Tip
In KANBAN view, you will have additional option to see status of a ticket within a process (sub-process or task Stage)
Based on the permission user has, it will provide options to filter the data.

User will have option to select "Business Process" like customer enquiry, customer complaint as may be designed by site administrator or management.
The "All Data" button will be available to users having role as "Planner".
if "All Data" switch is not available or switched OFF, you will get another option as below:

- The new filter available is "Filter On".
This filter has four options: (There options will be available based on role and permission).
- Assigned To Me:
- Assigned By Me:
- Started By Me:
- Within My Groups:
- if you select "Within My Group" as new filter will be available to select the group. These groups are user groups or process teams of the user is member and has permission as lead.

The Process Teams or User Groups will list groups for which the logged in user is member and has leader permission.
Select View has three options: KANBAN, Calendar and List. The information will be same as filtered only view will change. User can select whichever view he/she is comfortable to work.
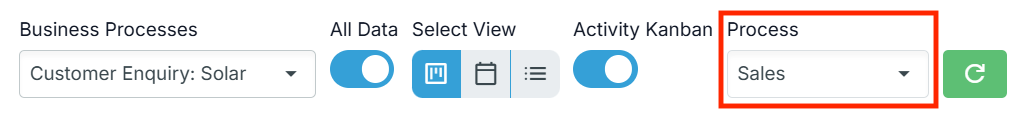
If your view is KANBAN, you get one more option, to view sub-process or activity wise KANAB for any selected process

or this as per your permission and selection

- Switch On the activity KANBAN switch and you will get an option to select the process. The KANBAN will now display sub-process or activities within this main process (for example: Sales)
Refresh to refresh the data in case required. Normally it will filter data based on change in selection.
Not Seen: This button displays the number of tickets or tasks or enquiries not seen yet or not approved yet for the business process selected.
In Progress: The KANBAN, calendar or list displays only "In Progress" tickets on the dashboard which are prime concern at any given point. This button displays the number of tickets or tasks based on filters applied.
Excel Button: Button with excel logo will export "In Progress" task list to excel. This button will be available if you have excel export permission. For "Not Seen" yet list check tickets menu. The fields being exported can be customized or decided by the administrator using Administration >> Set Export Fields menu.
Task Add Button: This will open add task or ticket page. (See details in Tickets menu)
Bell Button: Button with bell logo will show urgent or private messages send to you by other users or employees of the company. This button will be available only if "Enable Messaging" is enable in Site Admin >> Customization.
Bell button (or Notification button) will show any unseen messages you have received.
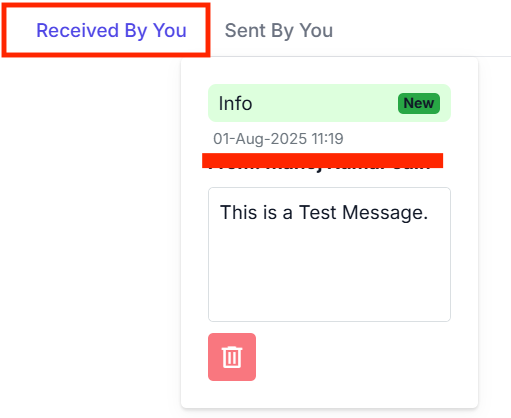
Clicking Bell Button will show you two tabs: "Received By You" and "Sent By You"
Under "Received By You" , obviously you will see messages meant for you. You will have option to delete. This deletion will not delete the message permanently but only delete it for you. Sender will still have it on his panel.
- under "Sent By You" you will see messages sent by you to other plus a "Form" to send messages.
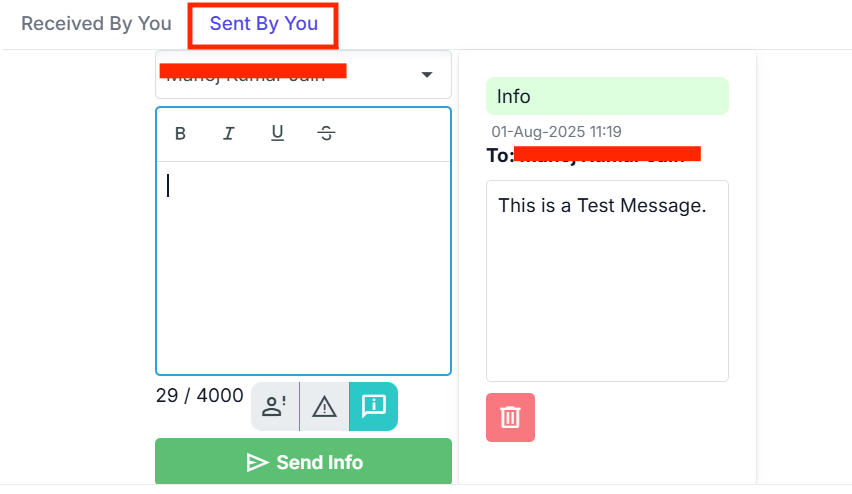
The message form has option to select the receiver, message text plus option to select type of message.
You can sent message as an "Alert" , "Warning" or "Info". These will be displayed in appropriate colours so that it is easy for sender and receiver both to identify the urgency associated with the message.
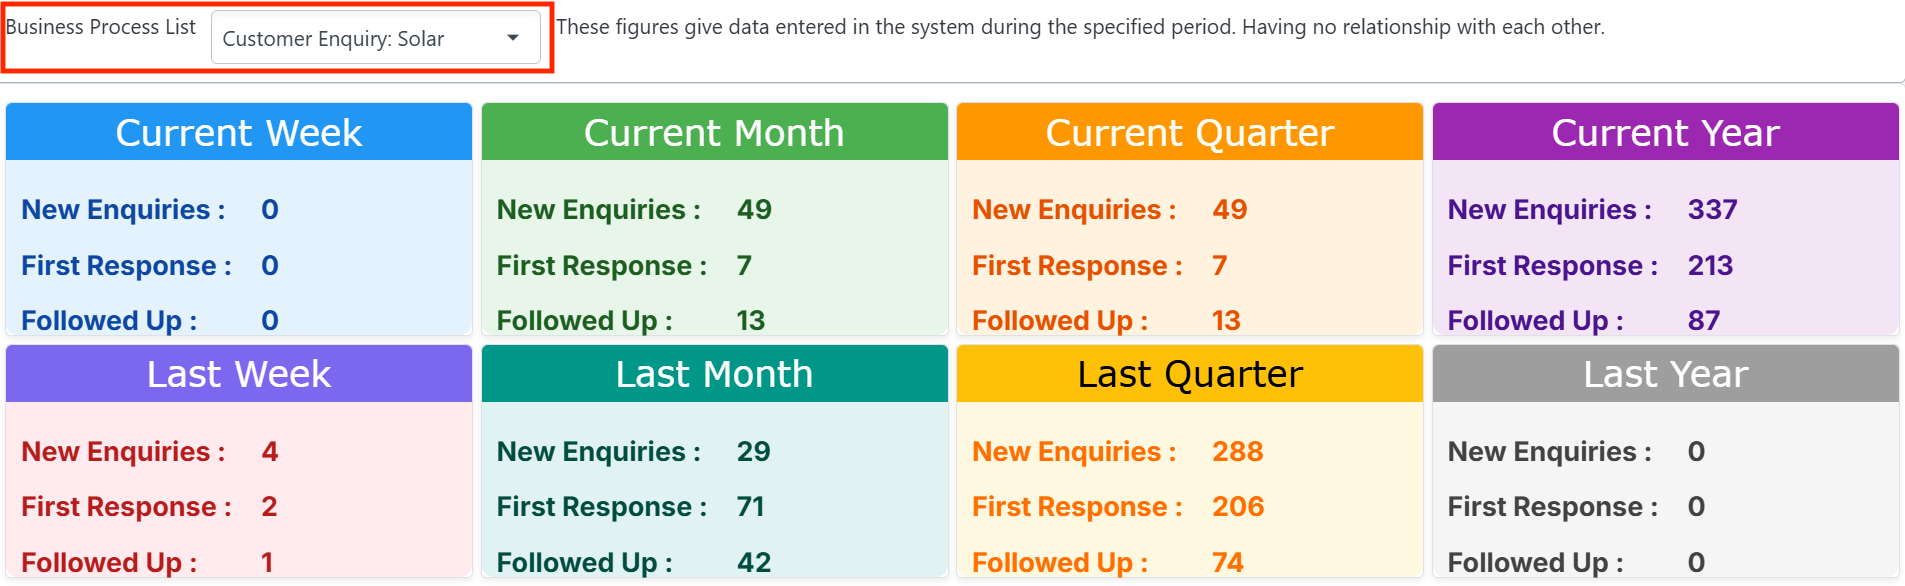
Data Statistics
This table simply shows number of records added. This should be used only to understand if there is data entry done and how much.
These figures give data entered in the system during the specified period. Having no relationship with each other.
For analysis use pie charts given in other tabs.
If Follow-up is done for one enquiry 7 times, this table will show seven more follow-ups.
The data is presented for following periods:
- Current and Last Week
- Current and Last Month
- Current and Last Quarter
- Current and Last Year
This should help you know that employees are using the system.
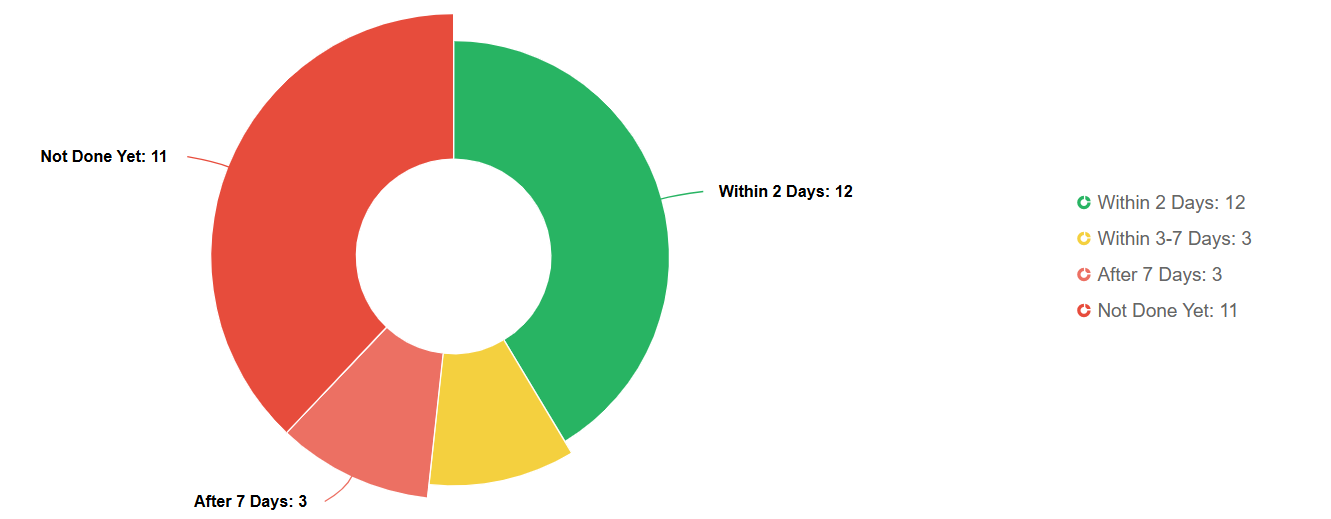
First Response Pie Chart
Providing a timely first response is critical for maintaining customer trust and satisfaction. This graph shows how quickly your team is responding to new customer enquiries or tickets.
The data collected based on original ticket dates and show how those tickets were responded.
The pie chart shows responses divided like:
- Within 2 Days
- within 3-7 Days
- After 7 Days
- Not done yet
The Pie charts are presented for following periods:
- Current and Last Week
- Current and Last Month
- Current and Last Quarter
- Current and Last Year
This should help you understand how quickly organization is responding to customer. This shows the agileness of the organization.
Click on the pie chart to see it full screen.
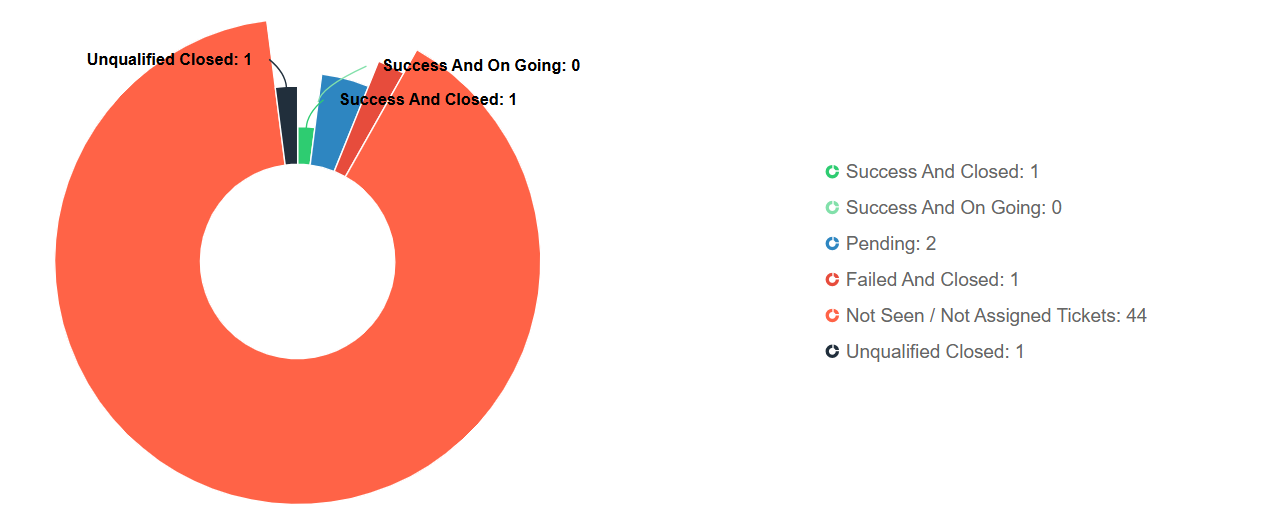
Success Pie Chart
This graph displays the percentage of tickets or enquiries successfully resolved. A high success rate reflects your team's ability to resolve issues efficiently and meet customer expectations. It helps you identify areas of improvement or processes that need better follow-up.
The data collected based on original ticket dates and show current status of these tickets.
The pie chart shows status divided like:
- Success and Closed
- Success and On Going
- Pending
- Failed and Closed
- Not Responded Yet
Important
Stage at which a workflow is considered Success is established in the workflow. See Creating Workflow.
The Pie charts are presented for following periods:
- Current and Last Week
- Current and Last Month
- Current and Last Quarter
- Current and Last Year
Click on the pie chart to see it full screen.